Using This Site To Learn About Business Analysis Artifacts
There are 34 business analysis artifacts contained in this site each with their own page. Every artifact is related to other artifacts and tasks that operate on the artifact. These relationships are captured with cross references to the related component using a hyperlink.
Artifacts are separated into groups of deliverables, external inputs and BA artifacts. Stakeholders working with these artifacts are described on the Stakeholders pages.
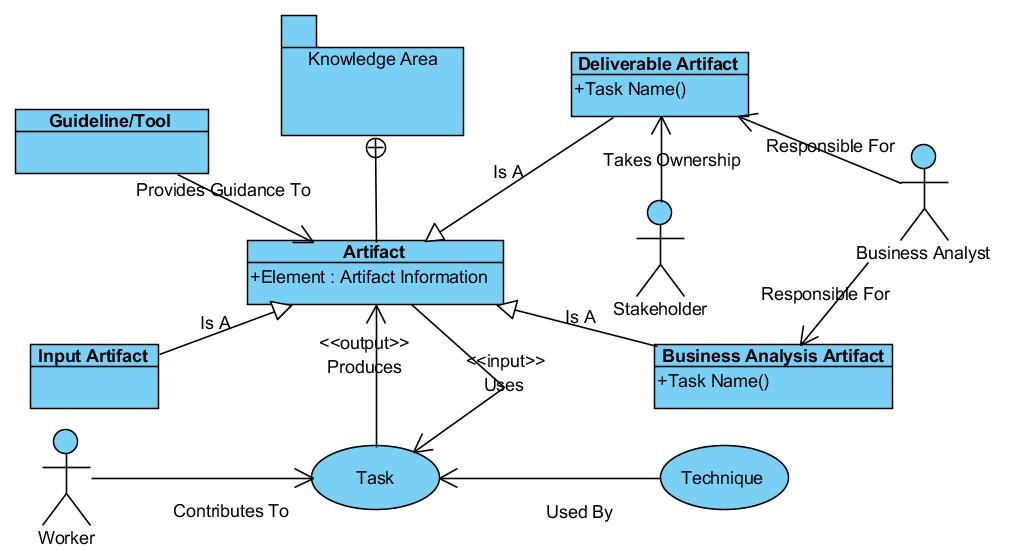
Knowledge Area (Package) - Artifacts are grouped by BABOK knowledge areas. Knowledge areas are not covered in this work.
Artifact (Class) - A task input or output. An artifact is defined by its elements (Attribute).
Input Artifact (Class) - Is an external input to the business analysis process.
Deliverable Artifact (Class) - Is an artifact that is delivered to a stakeholder.
Business Analysis Artifact - Is an artifact used to perform business analysis activities.
Guideline/Tool (Class) - Provides assistance with managing the artifact.
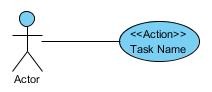
Task (Use Case) - Is activity performed by the BA, with assistance from workers, to create deliverable and business analysis artifacts.
Technique (Use Case) - Provides guidelines for performing a task.
Stakeholder (Actor) - Takes ownership of a deliverable artifact.
Worker (Actor) - Is a type of stakeholder, who assists the BA with updating and managing the artifact.
The following diagram shows the definitions and notation used within this web site.
How to read the diagrams
Five types of diagram are displayed on this web site:
Dependency Diagram - Shows the relationships between artifacts under discussion.
Artifact Diagram - Shows the inputs to an artifact, where the artifact is used and the artifact attributes and operations.
Guidelines/Tools and Techniques Diagram - Shows the guidelines, tools and techniques used by a task that operates on the artifact.
Stakeholders Diagram - Shows the roles played by people who interact with the artifact, as a contributor, reviewer or user.
Life-Cycle Diagram - When an artifact contains multiple operations, this diagram shows the states the artifact takes and the transitions between those states.
Dependency Diagram
A hierarchy of artifacts showing external inputs, how they feed into BA artifacts below them and how these are used to generate deliverable artifacts. This diagram uses class notation and relationships to show dependencies between artifacts.
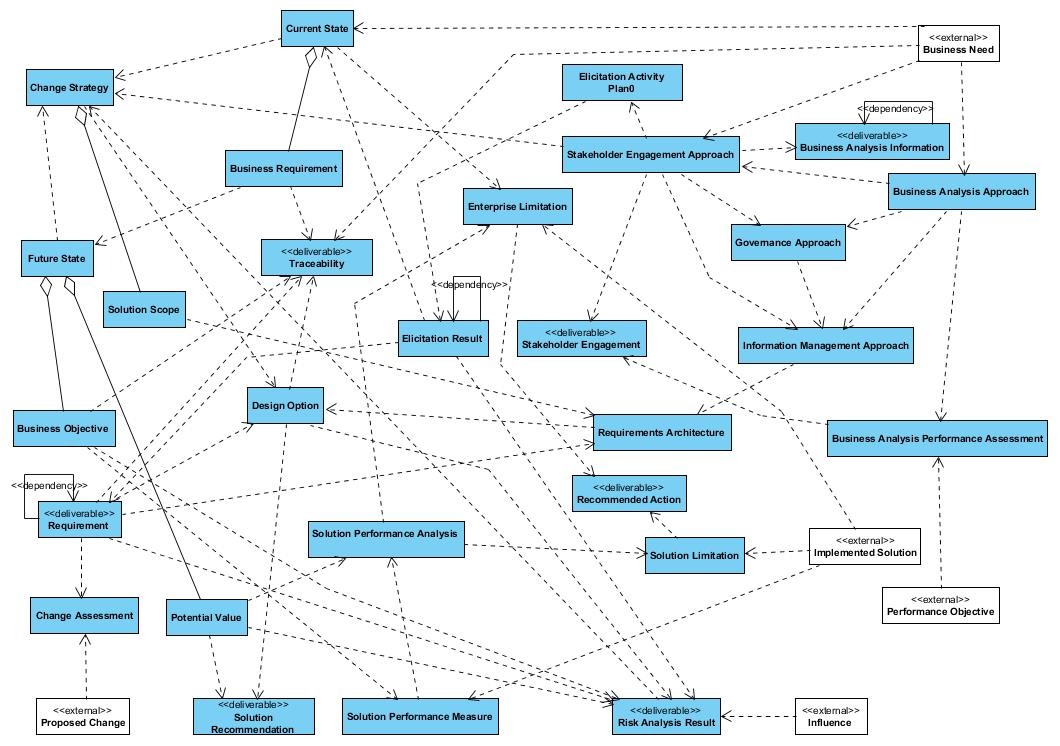
The following example contains all the artifacts on this web site and all the relationships between them on a single diagram. The diagram is broken down into dependency sub-diagrams for each of the deliverable artifacts. This allows the reader to determine the required work for a specific deliverable.
A dashed line shows a dependency, except when an artifact is dependent on itself, then the <<dependency>> label is attached to the line. An artifact is dependent on itself if it transitions through several states.
An artifact connected to a diamond shape on an arrowhead indicates that this artifact is a parent of the connecting artifacts. The parent contains the relationships, operations and states of its children.
Artifact Diagram
Information about a specific artifact, showing the artifact attributes, operations and relationships with other artifacts.
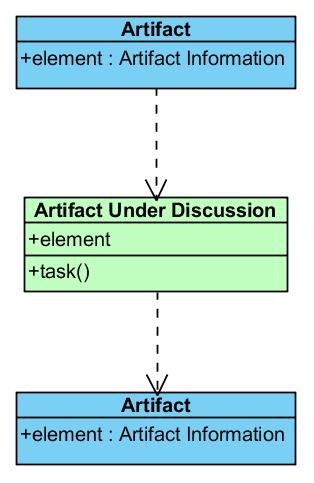
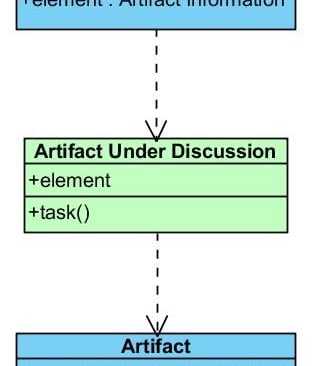
The artifact under discussion is colored green. Input artifacts are connected via a dependency into the artifact. Output artifacts are connected via a dependency out of the artifact.
Elements are shown as attributes of the artifact.
Tasks are shown as artifact operations.
Note: If there is no output artifact (it is a deliverable), the diagram shows the stakeholders receiving the artifact.
Note: There is always an input artifact.
Guidelines/Tools and Techniques Diagram
Contains the guidelines, tools and techniques for a specific artifact operation.
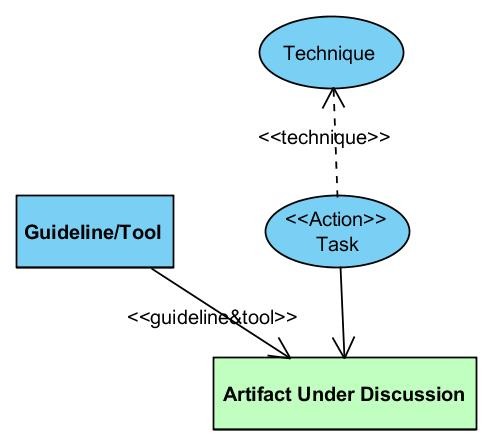
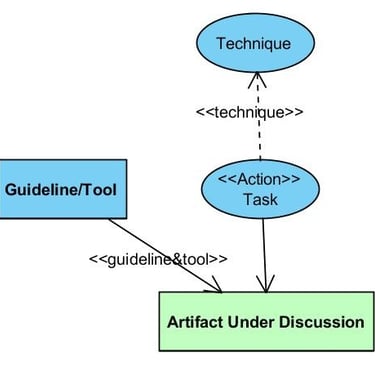
The artifact under discussion is colored green.
The operation is shown as a task connected to the artifact.
Techniques used by the task are connected the the task with a dependency exiting the task.
Guidelines and tools used by the artifact are shown as an input to the artifact.
Stakeholders Diagram
Shows the roles of people either receiving or working on the artifact.
The stakeholder is shown as an actor connected to the artifact.

Life-Cycle Diagram
A standard state transition diagram showing artifact states and transitions caused by operations. This diagram is only shown when an artifact contains more than 1 operation.
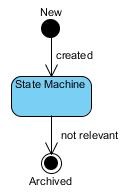

An artifact starts in a New state. It is created and a task operates on the artifact. When the artifact is no longer relevant to the project. it is archived.
Task List
A complete list of the 30 tasks in the BABOK.
https://www.lmunday.org/task-business-analysis-information-communicate
https://www.lmunday.org/task-business-analysis-performance-improvements
https://www.lmunday.org/task-information-management-approach
https://www.lmunday.org/task-recommended-action-to-increase-solution-value
https://www.lmunday.org/task-stakeholder-engagement-approach